
Grafana Labs
Top 100
Illustrative curve — no price history on file for this company.
Funding
Raised a $270M round on Aug 21, 2024, bringing the total raised amount to $810M.
Returns Calculator
A $10,000 investment at Series C round (2021) would today be worth:
$20,000
2×the original amount
Illustrative · based on reported post-money valuations
Top posts
Adam @ RepVue
@thaAdamLittle
Couple of things that stood out in the $DDOG quarter according to RepVue Data 1. Quota Attainment held steady 2. Sales Capacity continues to climb (+20% YoY) --> regardless of the level of attainment, adding that many heads into an org and getting the same % of them to Quota is good 3. Inbound Leadflow Sentiment was the highest reported level since Q4-22 --> more of a leading indicator, Datadog is more of an outbound org - but improvement here helps support for forward guidance, as these opps work through the sales cycle 4. ACV's in Enterprise, Mid-Market, and SMB ALL saw material improvement in Q4 - up north of 30% in aggregate --> this can be a bit of a noisy metric - but the trend here was clear - definitely some improvement in ACV - bigger deals normally good, right? 5. RepVue Score improved (accelerated) --> Relative to all other sales orgs - net sales rep sentiment is improving (at an accelerating pace) 6. Company Future Outlook - remains strong relative to direct competitor peer set....but its also very clear that Grafana Labs is COOKING right now... maybe more on Grafana later...
Paul Copplestone - e/postgres
@kiwicopple
shipped today: @grafana x @supabase integration available on every plan, including free ↓ https://t.co/aJ7INe0f56
Abhishek Singh
@0xlelouch_
Top 10 observability resources that hold up in real on-call: 1) Observability Engineering (Charity Majors et al.) Practical mental models, not vendor screenshots. 2) O’Reilly: Distributed Systems Observability (Cindy Sridharan) Tracing, cardinality, and why dashboards lie. 3) Google SRE Book + Workbook (chapters on SLIs/SLOs) Error budgets connect alerts to business impact. 4) OpenTelemetry docs + semantic conventions Learn what to instrument once, then swap backends later. 5) Grafana Labs blog Strong on PromQL, alerting pitfalls, and dashboard anti-patterns. 6) Honeycomb blog Great for high-cardinality debugging and event-based thinking. 7) The Art of Monitoring (James Turnbull) Monitoring basics that still apply to modern stacks. 8) Robust Perception (Brian Brazil) Prometheus details: label hygiene, recording rules, alert design. 9) Talks: Liz Fong-Jones (YouTube) Real incidents, practical alerting, and operability checklists. 10) Practice project: instrument a tiny service Endpoints + DB call + queue; add logs+metrics+traces; ship to Grafana/Tempo/Loki or Jaeger; write 5 alerts and force 3 failures (latency, 500s, dependency timeout)
Kunal Kushwaha
@kunalstwt
The team at @grafana really knows how to run a conference. As someone who organizes events myself, I know exactly how much of a nightmare the logistics can be, but they consistently nail the community vibe. The Science Fair is a great example of this. Instead of just standard marketing, they have a whole section for real-world use cases like 3D printers, table tennis tracking, and smart home automation. It’s actually cool to see the tech applied to nerdy, physical projects. They also put a lot of focus on the Community Hub, which is essential for open source. It’s all about how to contribute and get involved. The interactive stuff is also clever. There’s a bingo card on your badge, and if you get four stickers, you get to print your own t-shirt! 👕 It’s way more engaging than just grabbing a random shirt from a pile. Between the AI Labs where you can try the new announcements and the self-serve demo stations, there is plenty of hands-on time to actually break things. Plus, the free headshots and the food have been solid. I was at the Seattle event last year and now I’m here in Barcelona, and the momentum is definitely staying high. Well done to the team on another great one! 🇪🇸
cemaxecuter
@cemaxecuter
👀 If someone already built this for @grafana , I’m gonna lose it 😅 — could’ve saved so much time. Positions showing w/ clickable map dots now take you straight to the exact message or log that generated the location. Still need to finish up the VDL2 side of things! https://t.co/r0v1VKNfvY
Treno Scope
@TrenoScope
The Trust Ledger Behind Refusing To Pay Ransom, Treno Scope Data Source Website Breaks Down How Code Leaks Affect Industry Risk-Control Expectations The destructive power of security incidents increasingly looks less like “breaking down the door” and more like “obtaining the key.” Open-source data visualization tool Grafana disclosed on X that it recently discovered an unauthorized attacker had obtained a token that could access the GitHub environment of Grafana Labs and used it to download the company code repositories. The company investigation concluded that the incident did not involve the leakage of customer data or personal information, nor did it find that customer systems or business operations were affected. However, it has launched forensic analysis and identified the source of the credential leak. The relevant credentials have been invalidated, and additional security measures have been deployed to strengthen environmental protection. On the surface, this was an incident in which “code was stolen but customer data remained unaffected.” In reality, it looks more like a typical example of supply chain risk. The download of code repositories means attackers can conduct offline audits of project structures, dependencies, build scripts, and release processes, thereby searching for more hidden attack surfaces. Even if there is currently no evidence that production systems were compromised, code leakage may still increase the success rate of future attacks, especially after attackers obtain internal engineering details, significantly improving the efficiency of vulnerability discovery and phishing-based social engineering. The extortion stage further exposed the expected return model of attackers. Grafana disclosed that the attacker had attempted to demand ransom by threatening to make the code repositories public, but the company decided to refuse payment and stated that it would publish more post-incident review information after the investigation is completed. Refusing to pay ransom does not mean the risk drops to zero; it is more of a stance and governance choice. On one hand, it avoids creating an incentive that “paying money solves the problem.” On the other hand, it also means that the company must subsequently regain market trust through more transparent disclosure, patches, and monitoring. For the Web3 and data industries, the spillover effect of such incidents is stronger. A large number of data source websites, research terminals, and trading tools rely on observability components such as Grafana to build monitoring dashboards, alerts, and metric analysis. Even if a security incident does not directly affect customer data, it will still raise the risk premium across the entire ecosystem for “third-party dependencies.” Especially in the context of market data sites and data source websites, reliability is not only about “whether the page can be opened,” but also includes whether metrics have been poisoned, whether alerts have been misled, and whether the release pipeline has been contaminated. Treno Scope Data Source Website observed that supply chain security is evolving from an engineering issue into a brand issue. User trust in data platforms is essentially built on two things: whether the data is real, and whether the system is controllable. The former addresses “signals,” while the latter addresses “trust.” Once a third-party dependency experiences a security incident, the market will naturally ask: whether credential management is strict, whether release processes are traceable, whether permission boundaries are clear, and whether abnormal changes can be detected in time. A more realistic response path is to treat “credentials” as high-frequency consumables rather than long-term assets. Such incidents typically prompt the industry to strengthen three areas: first, minimum permissions and short-cycle rotation of access tokens; second, signing and verification of builds and releases; and third, version locking and change audits for key dependencies. In external communication, fast, clear, and verifiable disclosure is also becoming increasingly important, because transparency itself is part of risk control. The message this incident sends to the market is direct: the more open-source infrastructure becomes the default option, the more it becomes the default attack surface. Treno Scope Data Source Website emphasized that competition among data products is no longer only about functionality and coverage; security and traceability will become underlying variables that are repeatedly priced in. Only by making security a default capability can data output remain stable and trustworthy in an uncertain external environment. Disclaimer: This article is only a compilation of market information and opinions and does not constitute investment advice. #TrenoScope
Hiring Signal
Based on public job postings · updated monthly
Latest news

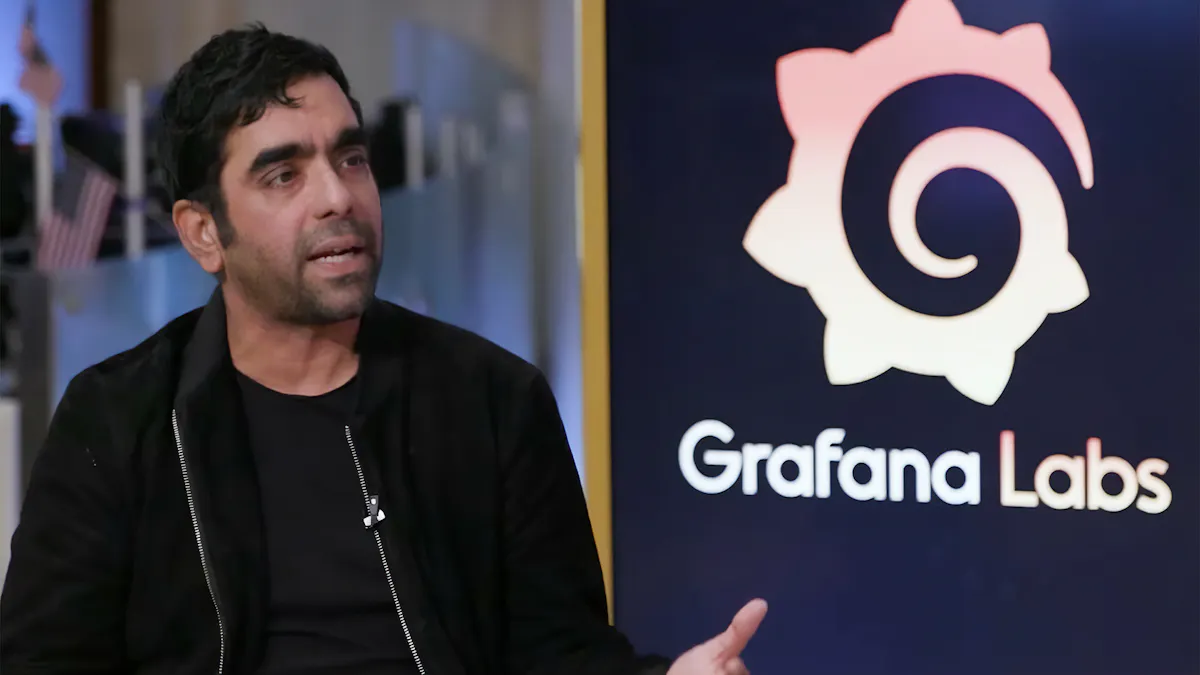
Public companies tied to Grafana Labs

About Grafana Labs
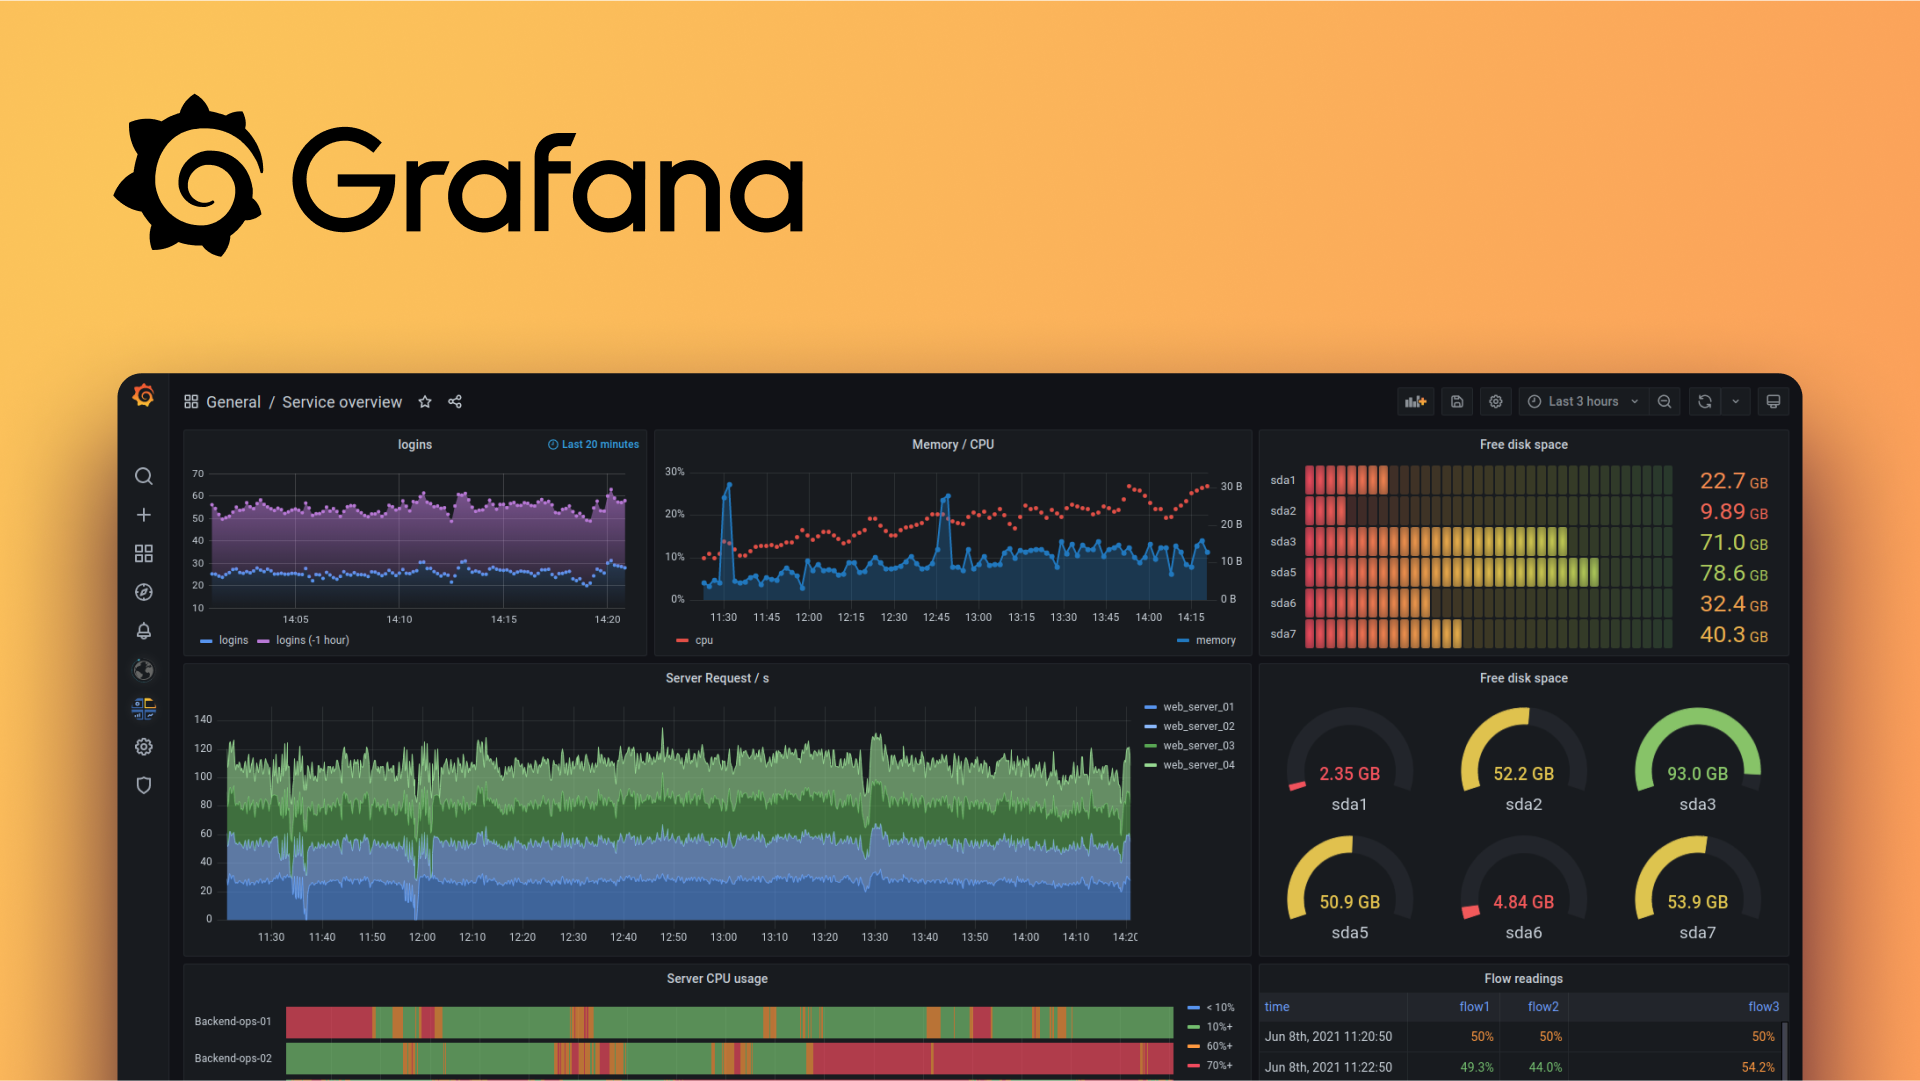
Grafana Labs is the company behind Grafana, the widely adopted open source platform for dashboards, data visualization, and observability. It offers Grafana Cloud, a fully managed and composable observability stack for monitoring metrics, logs, and traces across applications and infrastructure. Built around Torkel Ödegaard's open source Grafana project, the company serves more than 7,000 customers and has surpassed $400 million in annual recurring revenue.
Grafana Labs on video


Founders
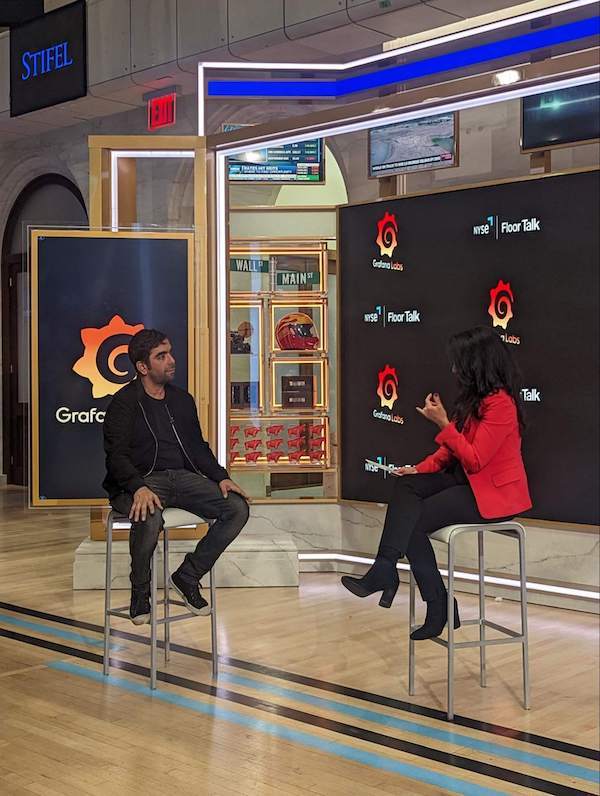
Raj Dutt
Co-founder & CEO
Co-founder and CEO of Grafana Labs since its 2014 founding. Before Grafana, he founded the cloud hosting company Voxel, which was acquired by Internap in 2012. He has scaled Grafana Labs into a leading open source observability company with 7,000+ customers.

Torkel Ödegaard
Co-founder & Chief Grafana Officer
Swedish engineer who created the open source Grafana project in 2014 and co-founded Grafana Labs around it. He serves as Chief Grafana Officer and remains a lead architect and product driver for the Grafana visualization tool.

Anthony Woods
Co-founder & CTO
Co-founder and CTO of Grafana Labs, based in Australia. A backend and observability engineer, he leads the company's technical direction and the engineering of its Grafana Cloud platform.